

Remote sensing is a science to acquire information from location without directly going to the location. Remote sensing can be performed using many kinds of vehicles, such as satellite, aerial vehicle, and unmanned aerial vehicle/drone. Image data acquired from different vehicle will have different way to process.
This article will discuss about one of the satellite images composite, Landsat 8 OLI. To do composite, some software can be used, like ENVI, ArcGIS, or QGIS. But, in this article, we will use Google Earth Engine cloud-computing. Landsat 8 OLI has bands shown as below.
| Band | Wavelength | Spatial Resolution |
| Band 1 Visible | 0.43 – 0.45 µm | 30 m |
| Band 2 Visible Blue | 0.450 – 0.51 µm) | 30 m |
| Band 3 Visible Green | 0.53 – 0.59 µm | 30 m |
| Band 4 Visible Red | 0.64 – 0.67 µm) | 30 m |
| Band 5 Near-Infrared (NIR) | 0.85 – 0.88 µm | 30 m |
| Band 6 Short Wave Infrared SWIR 1 | 1.57 – 1.65 µm) | 30 m |
| Band 7 SWIR 2 | 2.11 – 2.29 µm) | 30 m |
| Band 8 Panchromatic (PAN) | 0.50 – 0.68 µm | 15 m |
| Band 9 Cirrus | 1.36 – 1.38 µm | 30 m |
| Band 10 TIRS 1 | 10.6 – 11.19 µm) | 100 m |
| Band 11 TIRS 2 | 11.5 – 12.51 µm | 100 m |

Below is the spectral curve.


Mostly used Landsat 8 composite or monochrome:
1. Natural Color Composite, 432. Let’s start from 432 composite which shows natural color or true color. As its name suggests, this composite image shows the true color of objects. Vegetation is green, soil is brown, and water is blue. The brightness and contrast must be adjusted to display the image clearly.

2. Vegetation Composite, 654. This composite image is my favorite because it distinguishes clearly vegetation and non-vegetation. Vegetation is shown in green color and soil is in brown.

3. Geology Composite, 567. This composite image does not use visible wavelength (band 2, 3, and 4). It uses Near InfraRed, Short Wave InfraRed 1, and Short Wave InfraRed 2. Without visible wavelength, the surface relief is shown very clearly. Water body looks the darkest in this 567 composite. Vegetation is shown in orange color, and soil in tosque color.

The close view shows the mountain topography very clearly.

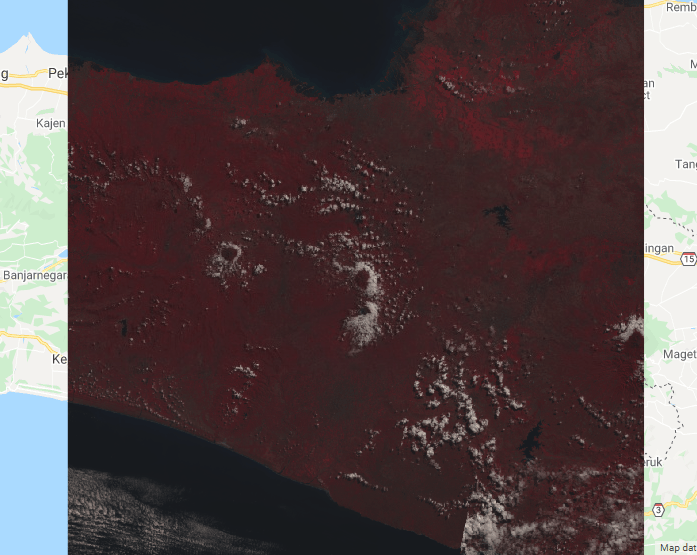
4. InfraRed Vegetation Composite, 543. This composite image highlights vegetation in red color.
5. Monochrome B4 (Red Wavelength). B4 is darker than B5 because the B4 reflectance is lower than B5 reflectance. Notice that vegetation is darker than bare soil.

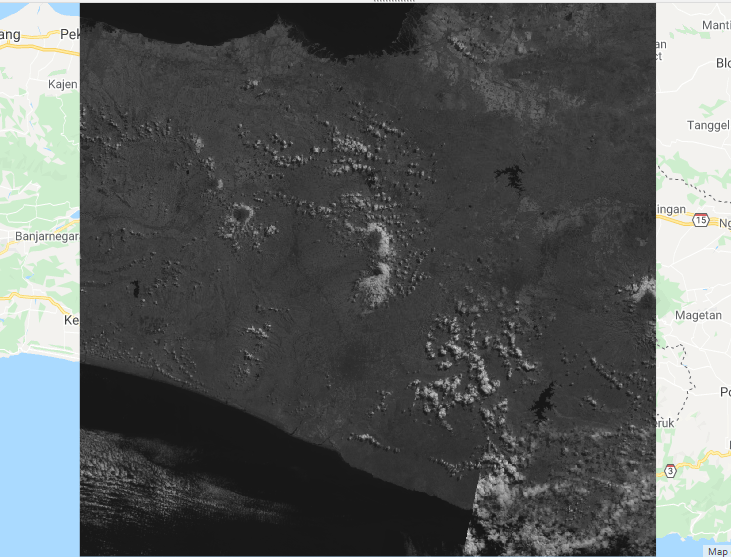
6. Monochrome B5 (Near InfraRed Wavelength). Unlike in B4, vegetation in B5 is lighter than bare soil. Overall, B5 is lighter than B4 because land cover objects reflect Near InfraRed wavelength more than they reflect Red wavelength.
Here is the Javascript script to display all the composite and monochrome images above.
// Composite Landsat 8 image collection and clip it to a boundary.

// Load Landsat 8 raw imagery and filter it to AAugust 2019.
var collection = ee.ImageCollection('LANDSAT/LC08/C01/T1')
    .filterDate('2019-08-01', '2019-08-15');

// Reduce the collection by taking the median.
var median = collection.median();

// Clip to the output image to the geometry boundary.
var clipped = median.clip(geometry);

// Display the result.
Map.setCenter(110.6319, -7.4668, 9);
var visParams = {bands: ['B4', 'B3', 'B2']};
Map.addLayer(clipped, visParams, 'Natural colour composite 432');

var visParams = {bands: ['B6', 'B5', 'B4']};
Map.addLayer(clipped, visParams, 'Vegetation composite 654');

var visParams = {bands: ['B5', 'B6', 'B7']};
Map.addLayer(clipped, visParams, 'Geology composite 567');

var visParams = {bands: ['B5', 'B4', 'B3']};
Map.addLayer(clipped, visParams, 'Infrared vegetation composite 543');

var visParams = {bands: ['B4', 'B3', 'B1']};
Map.addLayer(clipped, visParams, 'composite bathymetric 431');

var visParams = {bands: ['B5', 'B5', 'B5']};
Map.addLayer(clipped, visParams, 'monochrome B5');

var visParams = {bands: ['B4', 'B4', 'B4']};
Map.addLayer(clipped, visParams, 'monochrome B4');

1 thought on “Image Composite using Earth Engine (Landsat 8 OLI Satellite)”