

k-means is a unsupervised Machine Learning to perform cluster analysis. More discussion about Machine Learning can be found here. Cluster analysis is meant to divide a group of data points into clusters according to their similarity pattern. k-means locates a number of k centroids among the data points to which each data point is clustered to the nearest centroid. The location of the k or centroid represents the center of their clusters. The distance of centroid to each data point in the cluster is computed to be as small as possible. The number of k is the number of centroids or clusters that the data points will be distinguished into.
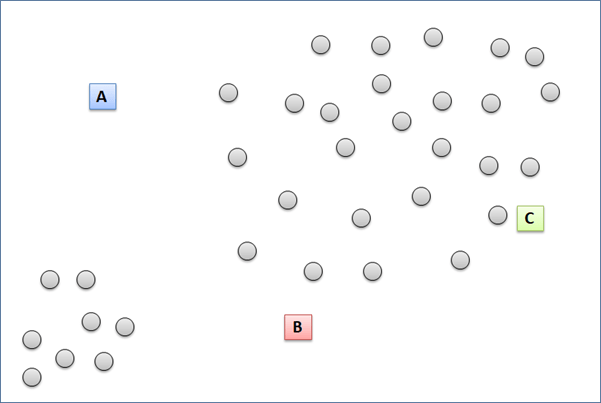
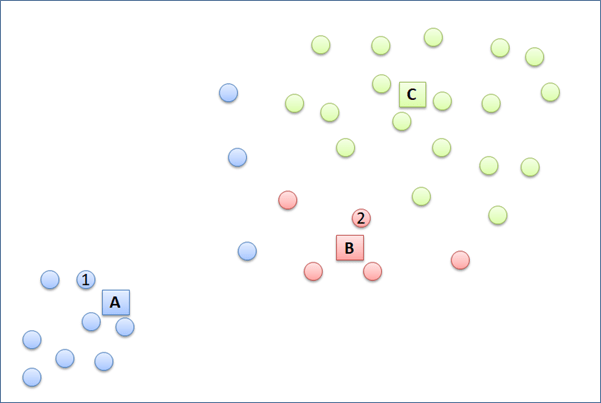
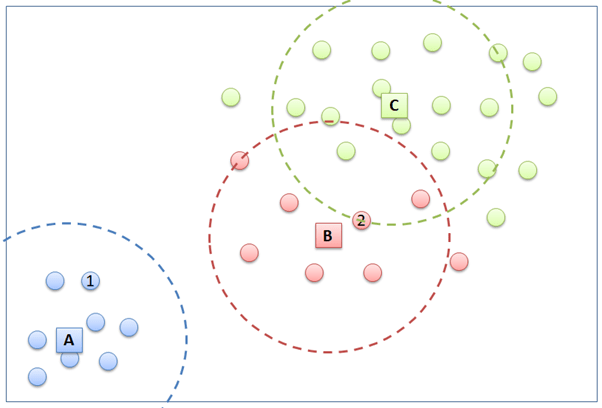
For illustration, we will try cluster the data points below into 3 clusters. K-means initializes with (1) randomly put 3 temporary centroids in the plot, let say they are A, B, and C. (2) Then, each of the data point will have distance to each of the three centroids. Each data point is then grouped temporarily according to the nearest centroid. For example, point 1 will be put into cluster A because its closest distance to centroid A compared with centroid B and C. How about point 2? To which cluster will it be assigned to? After that, each data point of the same cluster will relocate the temporary centroid to a new location. The new centroid location is is expected to be at the center of cluster. (3) The new centroid location is computed based on the total distance of the centroid to the every data point in the same cluster divided by the total number of the data points in the same cluster. Next, step number (2 ) and (3) will be iterated until the centroid location does not change anymore.


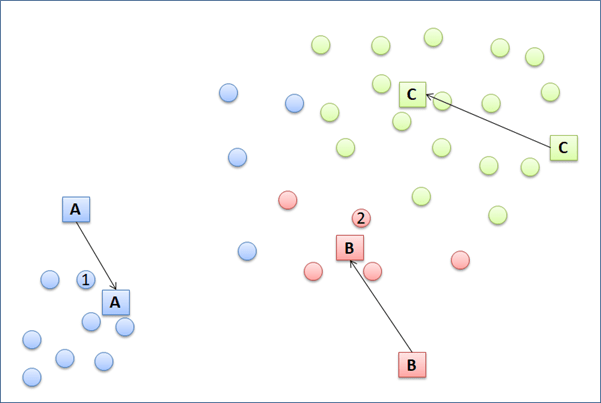
Notice that a few points change to another cluster in the second clustering iteration.
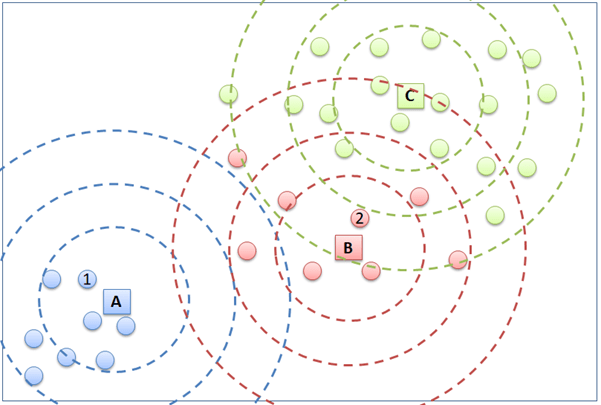
Now that the centroid locations are stable and the data points are confirmed to group to the respective clusters, the clustering is process done.
Now, we will run the k-means to a little bit more complex data, the Hotel Customer Data. The data is dummy data I created. The data contains the information of customers opinion of a hotel. There are 500 observations or rows in this data frame. Each observation represents one customer. There are 12 variables, with data structure as following.
> str(CustomerData)
data.frame':   500 obs. of  12 variables:
 $ Id          : int  1 2 3 4 5 6 7 8 9 10 ...
 $ Gender      : Factor w/ 2 levels "Female","Male": 1 1 1 2 2 2 2 1 2 2 ...
 $ Age         : num  33 30 37 34 33 34 35 30 39 34 ...
 $ Purpose     : Factor w/ 2 levels "Business","Personal": 2 2 2 2 2 2 2 2 1 2 ...
 $ RoomType    : Factor w/ 3 levels "Double","Family",..: 1 2 3 1 1 1 1 2 1 1 ...
 $ Food        : num  21 32 46 72 84 67 56 10 73 97 ...
 $ Bed         : num  53 32 25 30 7 46 0 19 12 30 ...
 $ Bathroom    : num  24 18 29 15 43 16 0 1 62 26 ...
 $ Cleanness   : num  44 44 20 55 78 61 9 53 65 59 ...
 $ Service     : num  46 74 24 38 51 44 32 58 56 46 ...
 $ Satisfaction: Factor w/ 3 levels "Dissatisfied",..: 1 1 1 1 2 2 1 1 2 2 ...
 $ Repeat      : Factor w/ 2 levels "No","Repeat": 2 1 1 2 2 1 1 2 2 1 ...
Customers are requested to fill a survey form to score 5 parameters of the hotel. The 5 parameters are food, bed, bathroom, cleanness, and service. The five parameters are scored in numeric from 0 to 100. 0 represents very bad and 100 represents very good. The objective of this article is to group the 500 observations in clusters according to the value of the five parameters.
If you have read my other articles discussion kNN and Decision Tree, those Machine Learning methods classify the Hotel Customer Data according to parameters to 3 classes: “satisfied”, “neutral”, and “dissatisfied”. This is supervised classifications. The discussed k-means in this article does not do that. In performing unsupervised k-means, the number and name of clusters are not defined.
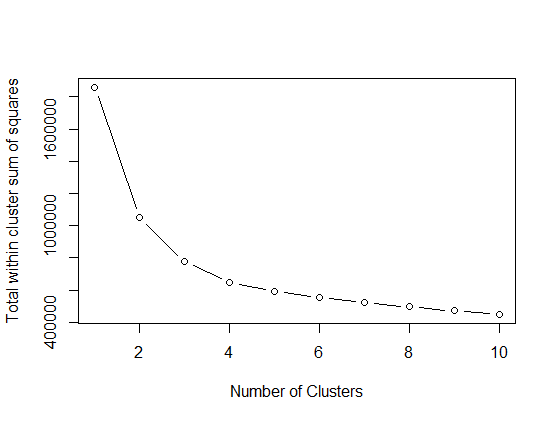
The following script runs k-means 10 times, assigning the number of centroid from 1 to 10. For each of the assigned centroid number, total within cluster sum of squares is recorded. Total within sum of squares (tot.withinss) is the sum of squared distance between every data point to the centroid within the cluster. The graph below plots number of cluster in x-axis and tot.withinss in the y-axis. The more the number of cluster is, the lower the tot.withinss is. Here, the suitable number of clusters are chosen where the tot.withinss does not get lower significantly anymore. So, it is decided that Hotel Customer data will be divided into 4 clusters.
# selecting number of k center
# Set variable for total within sum of squares error
TotWithin <- 0

# Perform kmeans cluster by number of center 1 until 10
for (i in 1:10) {
  Cluster_kmean <- kmeans(CustomerData[6:10], centers = i, nstart = 30)
  # Save total within sum of squares to wss variable
  TotWithin[i] <- Cluster_kmean$tot.withinss
}


# Scree plot total within sum of squares vs number of clusters.
# Find where cluster quality does not improve significantly anymore
plot(1:10, TotWithin, type = "b",
     xlab = "Number of Clusters",
     ylab = "Total within cluster sum of squares")
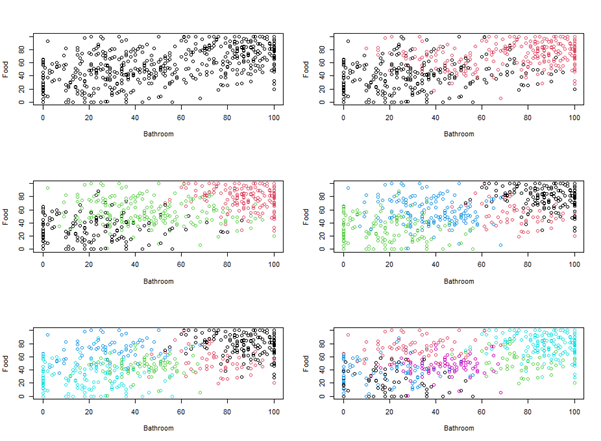
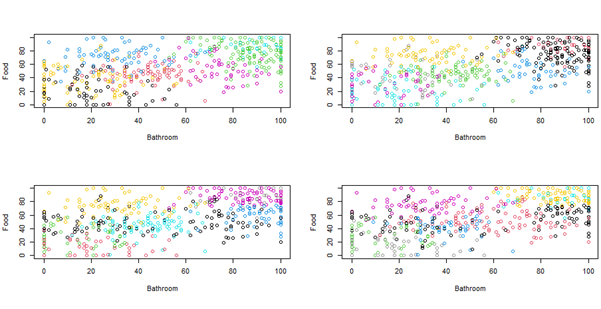
The following visualizes the result of grouping the data into 2 until 10 clusters. But, the disadvantage of the visualization is that it can only show 2 and 3 parameters. We actually have 5 parameters. So, we choose only two parameters, “food”, and “bathroom” to make it simple.
# Set plots arrangement
par(mfrow = c(3, 2))

# Visualize cluster with k center 1 to 10
Cluster_kmean_1 <- kmeans(CustomerData[6:10],center =  1, nstart =30)
plot(CustomerData$Food ~ CustomerData$Bathroom, col = Cluster_kmean_1$cluster, xlab = "Bathroom", ylab  = "Food")

Cluster_kmean_2 <- kmeans(CustomerData[6:10],center =  2, nstart =30)
plot(CustomerData$Food ~ CustomerData$Bathroom, col = Cluster_kmean_2$cluster, xlab = "Bathroom", ylab  = "Food")

Cluster_kmean_3 <- kmeans(CustomerData[6:10],center =  3, nstart =30)
plot(CustomerData$Food ~ CustomerData$Bathroom, col = Cluster_kmean_3$cluster, xlab = "Bathroom", ylab  = "Food")

Cluster_kmean_4 <- kmeans(CustomerData[6:10],center =  4, nstart =30)
plot(CustomerData$Food ~ CustomerData$Bathroom, col = Cluster_kmean_4$cluster, xlab = "Bathroom", ylab  = "Food")

Cluster_kmean_5 <- kmeans(CustomerData[6:10],center =  5, nstart =30)
plot(CustomerData$Food ~ CustomerData$Bathroom, col = Cluster_kmean_5$cluster, xlab = "Bathroom", ylab  = "Food")

Cluster_kmean_6 <- kmeans(CustomerData[6:10],center =  6, nstart =30)
plot(CustomerData$Food ~ CustomerData$Bathroom, col = Cluster_kmean_6$cluster, xlab = "Bathroom", ylab  = "Food")

Cluster_kmean_7 <- kmeans(CustomerData[6:10],center =  7, nstart =30)
plot(CustomerData$Food ~ CustomerData$Bathroom, col = Cluster_kmean_7$cluster, xlab = "Bathroom", ylab  = "Food")

Cluster_kmean_8 <- kmeans(CustomerData[6:10],center =  8, nstart =30)
plot(CustomerData$Food ~ CustomerData$Bathroom, col = Cluster_kmean_8$cluster, xlab = "Bathroom", ylab  = "Food")

Cluster_kmean_9 <- kmeans(CustomerData[6:10],center =  9, nstart =30)
plot(CustomerData$Food ~ CustomerData$Bathroom, col = Cluster_kmean_9$cluster, xlab = "Bathroom", ylab  = "Food")

Cluster_kmean_10 <- kmeans(CustomerData[6:10],center =  10, nstart =30)
plot(CustomerData$Food ~ CustomerData$Bathroom, col = Cluster_kmean_10$cluster, xlab = "Bathroom", ylab  = "Food")
As it is decided to use 4 centroids to do the clustering, the following is the script to do so.
# Perform kmeans cluster with selected k center  4
Cluster_kmean2 <- kmeans(CustomerData[6:10],center =  4, nstart =30)
Here is the clustering result of te first 20 observations.
   Food Bed Bathroom Cleanness Service kmeans
1    21  53       24        44      46      4
2    32  32       18        44      74      4
3    46  25       29        20      24      4
4    72  30       15        55      38      2
5    84   7       43        78      51      2
6    67  46       16        61      44      2
7    56   0        0         9      32      4
8    10  19        1        53      58      4
9    73  12       62        65      56      2
10   97  30       26        59      46      2
11   98  81       96        82      61      1
12   50  76       26        74      31      2
13   48  29       21        94      32      2
14   83  61       15        79      51      2
15   49  63       45        80      44      2
16   85  70      100        99      54      1
17   80  99       91       100      57      1
18   80  66      100        66      55      1
19   79  93       69        96      84      1
20    0  50        0        10      36      4
Here is the data distribution of the 4 clusters. We can examine that every cluster has unique characteristics that make it different from the other cluster. Cluster 1 is a group of hotel customers who are the most satisfied in the five parameters. Cluster 4, on the other hand, gathers the hotel customers who gave lowest score for the 5 parameters. Cluster 2 and 3 consists of customers who scored medium for the five parameters. What apparently separates cluster 2 and 3 is their opinion to the “bathroom” and “cleanness” parameters. Cluster 2 customers felt that the bathroom was less good enough than cluster 3 customers felt. Cluster 2 customers were more satisfied with the hotel cleanness than cluster 3 customers were.
# Analyse each cluster
par(mfrow = c(3, 2))

boxplot(Food ~ kmeans, data = Customer_kmeans)
boxplot(Bed ~ kmeans, data = Customer_kmeans)
boxplot(Bathroom ~ kmeans, data = Customer_kmeans)
boxplot(Cleanness ~ kmeans, data = Customer_kmeans)
boxplot(Service ~ kmeans, data = Customer_kmeans)


1 thought on “K-means”